Let's Work Together
Let Us Build
Let's us talk about your idea and how I can help bring it to life.
An Engineer, Data Whisperer, StoryTeller in Words and Code.
Helping people solve real world problems.

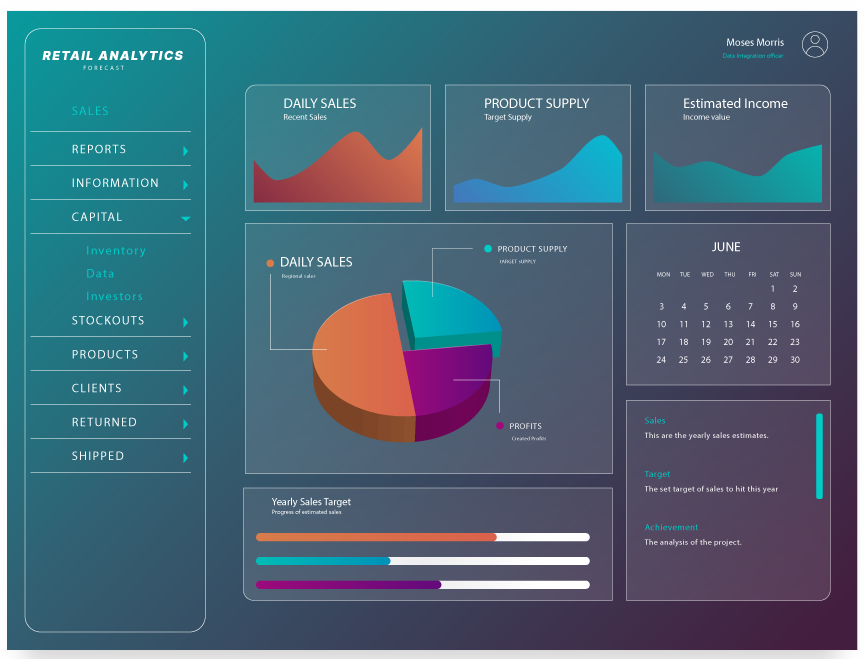
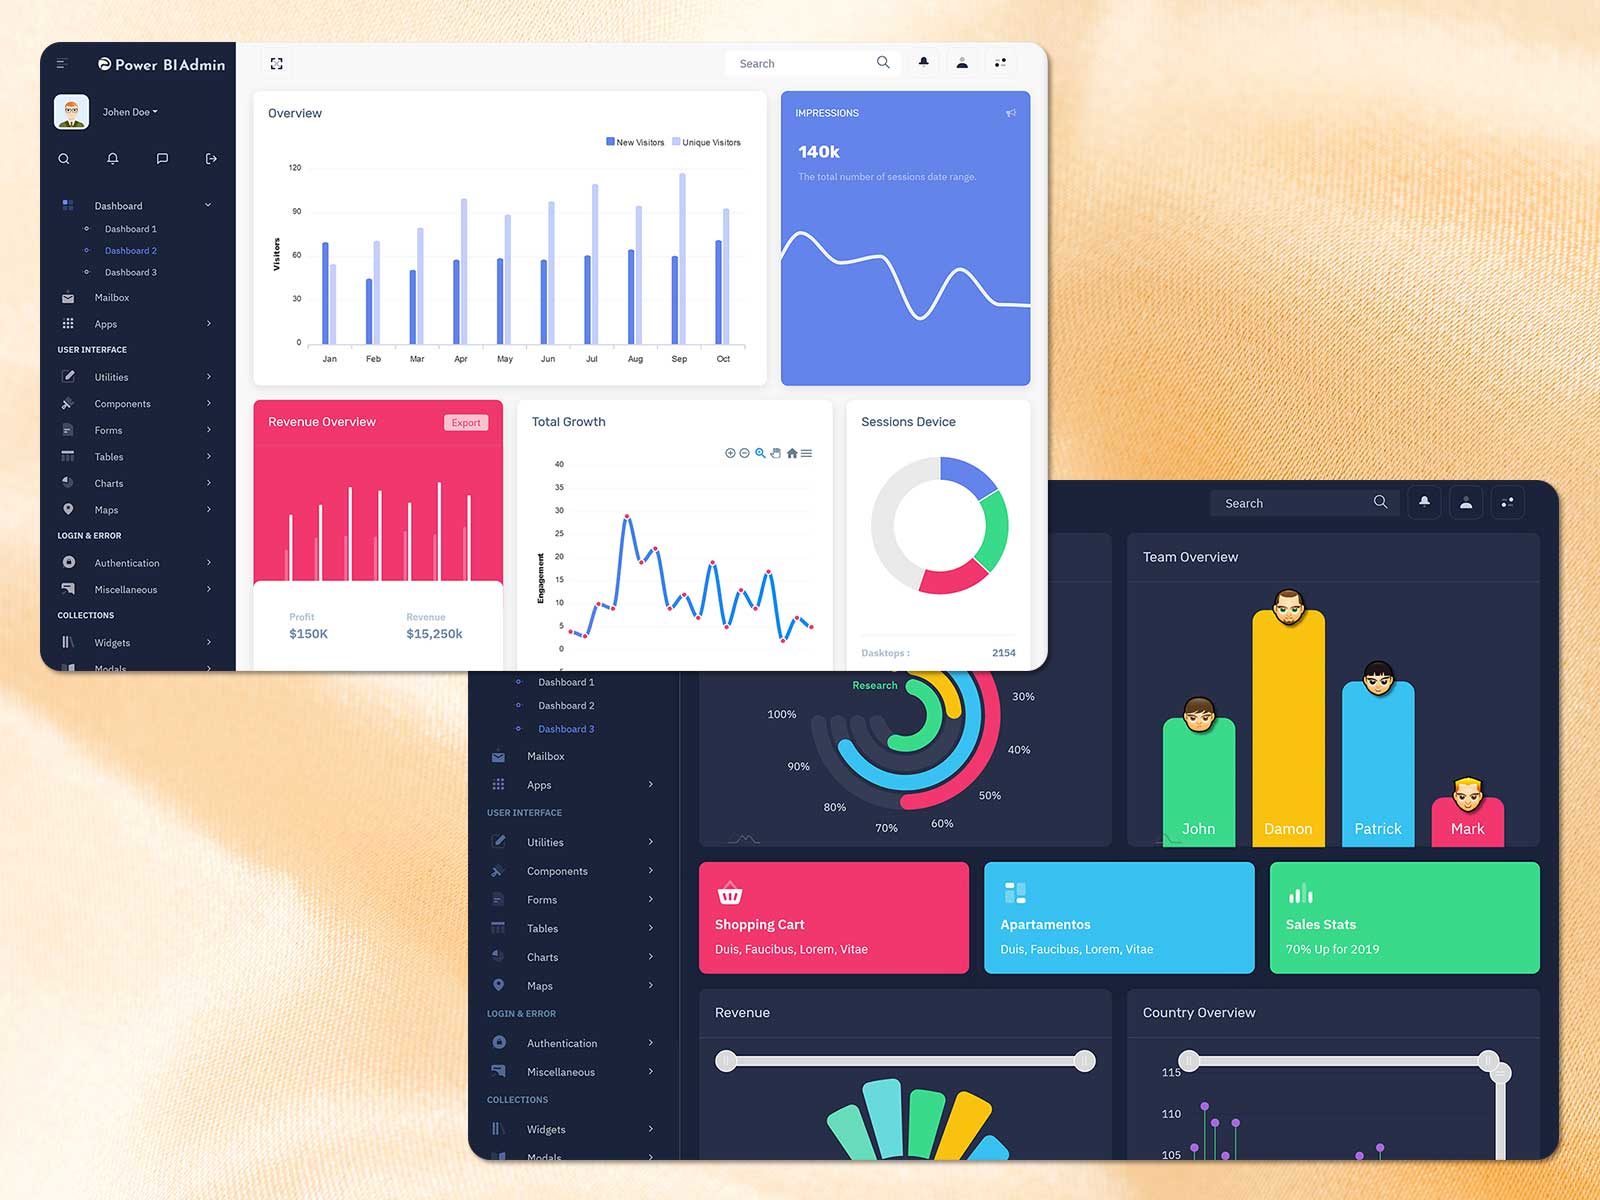
A comprehensive data engineering solution that processes 15,000+ records daily from multiple data sources, performs advanced analytics using NumPy and Pandas, and delivers actionable insights through interactive Power BI dashboards for business intelligence and decision-making.
Data EngineeringIn the fast-paced world of e-commerce, businesses generate massive amounts of data every second-from customer interactions and sales transactions to marketing campaigns and website traffic. However, raw data alone doesn't drive decisions; it's the insights hidden within that data that matter. This project was born from the need to transform scattered, unstructured data into a unified, actionable analytics platform that empowers stakeholders to make data-driven decisions in real-time. The challenge was to build a scalable data pipeline that could handle diverse data sources, perform complex transformations, and present insights through intuitive visualizations.
The client was struggling with fragmented data across multiple systems—customer data in CRM, sales in ERP, marketing metrics in various tools, and website analytics scattered across platforms. Manual Excel-based reporting took days to compile, was error-prone, and by the time reports were ready, the insights were already outdated. There was no way to track customer behavior patterns, measure marketing ROI effectively, or identify which products were driving profitability. The business needed a centralized data warehouse with automated ETL pipelines and real-time dashboards to monitor KPIs, understand customer segments, and optimize marketing spend.
Build an end-to-end data engineering solution that consolidates data from disparate sources, performs data cleaning and transformation using Python (NumPy and Pandas), implements advanced analytics including RFM segmentation and cohort analysis, and delivers interactive Power BI dashboards. The solution needed to process 5,000+ daily transactions, track 10,000+ website sessions, analyze 500+ customers, monitor 20+ marketing campaigns, and provide real-time insights with sub-second query response times. The platform should enable business users to explore data independently without technical expertise.
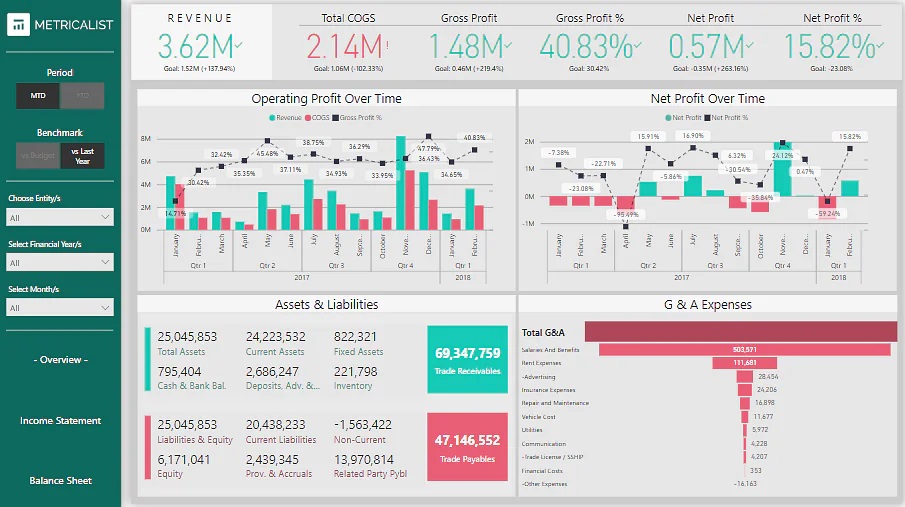
The data engineering platform transformed how the business operates. Decision-making speed increased by 400% as stakeholders now have real-time access to KPIs instead of waiting days for manual reports. The RFM analysis identified that Champions (top 15% of customers) contributed 65% of total revenue, enabling targeted retention campaigns. Marketing ROI improved by 180% by identifying underperforming channels and reallocating budget to high-ROI campaigns (Email: 250% ROI, Social Media: 180% ROI). Website conversion rate optimization based on traffic analysis increased conversions from 8% to 12.5%, adding KES 2.8M in monthly revenue. Product category insights revealed that Electronics generated 42% of revenue but only 18% of transactions, leading to bundling strategies that increased average order value by 35%. The automated ETL pipeline reduced data processing time from 8 hours (manual) to 45 minutes (automated), freeing up data team for strategic analysis.
• Total revenue tracked: KES 48.5M+ across 5,000 transactions • Profit margin calculated: 42.3% average with detailed product-level analysis • Average Order Value: KES 9,700 (35% increase post-optimization) • Customer Lifetime Value: KES 50,000 average (tracked across 500 customers) • RFM Segments: 15% Champions, 35% Loyal, 32% Potential, 18% At Risk • Marketing ROI: 165% average across 20 campaigns • Website metrics: 8% → 12.5% conversion rate, 35% → 28% bounce rate • Data processing efficiency: 90% reduction in manual reporting time • Dashboard adoption: 95% of stakeholders actively use dashboards daily • Query performance: <2 seconds for complex analytical queries • Business impact: KES 8.2M additional annual revenue from data-driven optimizations • Client satisfaction: 4.9/5 rating with request for Phase 2 enhancements
Let's us talk about your idea and how I can help bring it to life.
An Engineer, Data Whisperer, StoryTeller in Words and Code.
Helping people solve real world problems.
Hi 👋
Need help? Chat with us on WhatsApp!