Let's Work Together
Let Us Build
Let's us talk about your idea and how I can help bring it to life.
An Engineer, Data Whisperer, StoryTeller in Words and Code.
Helping people solve real world problems.

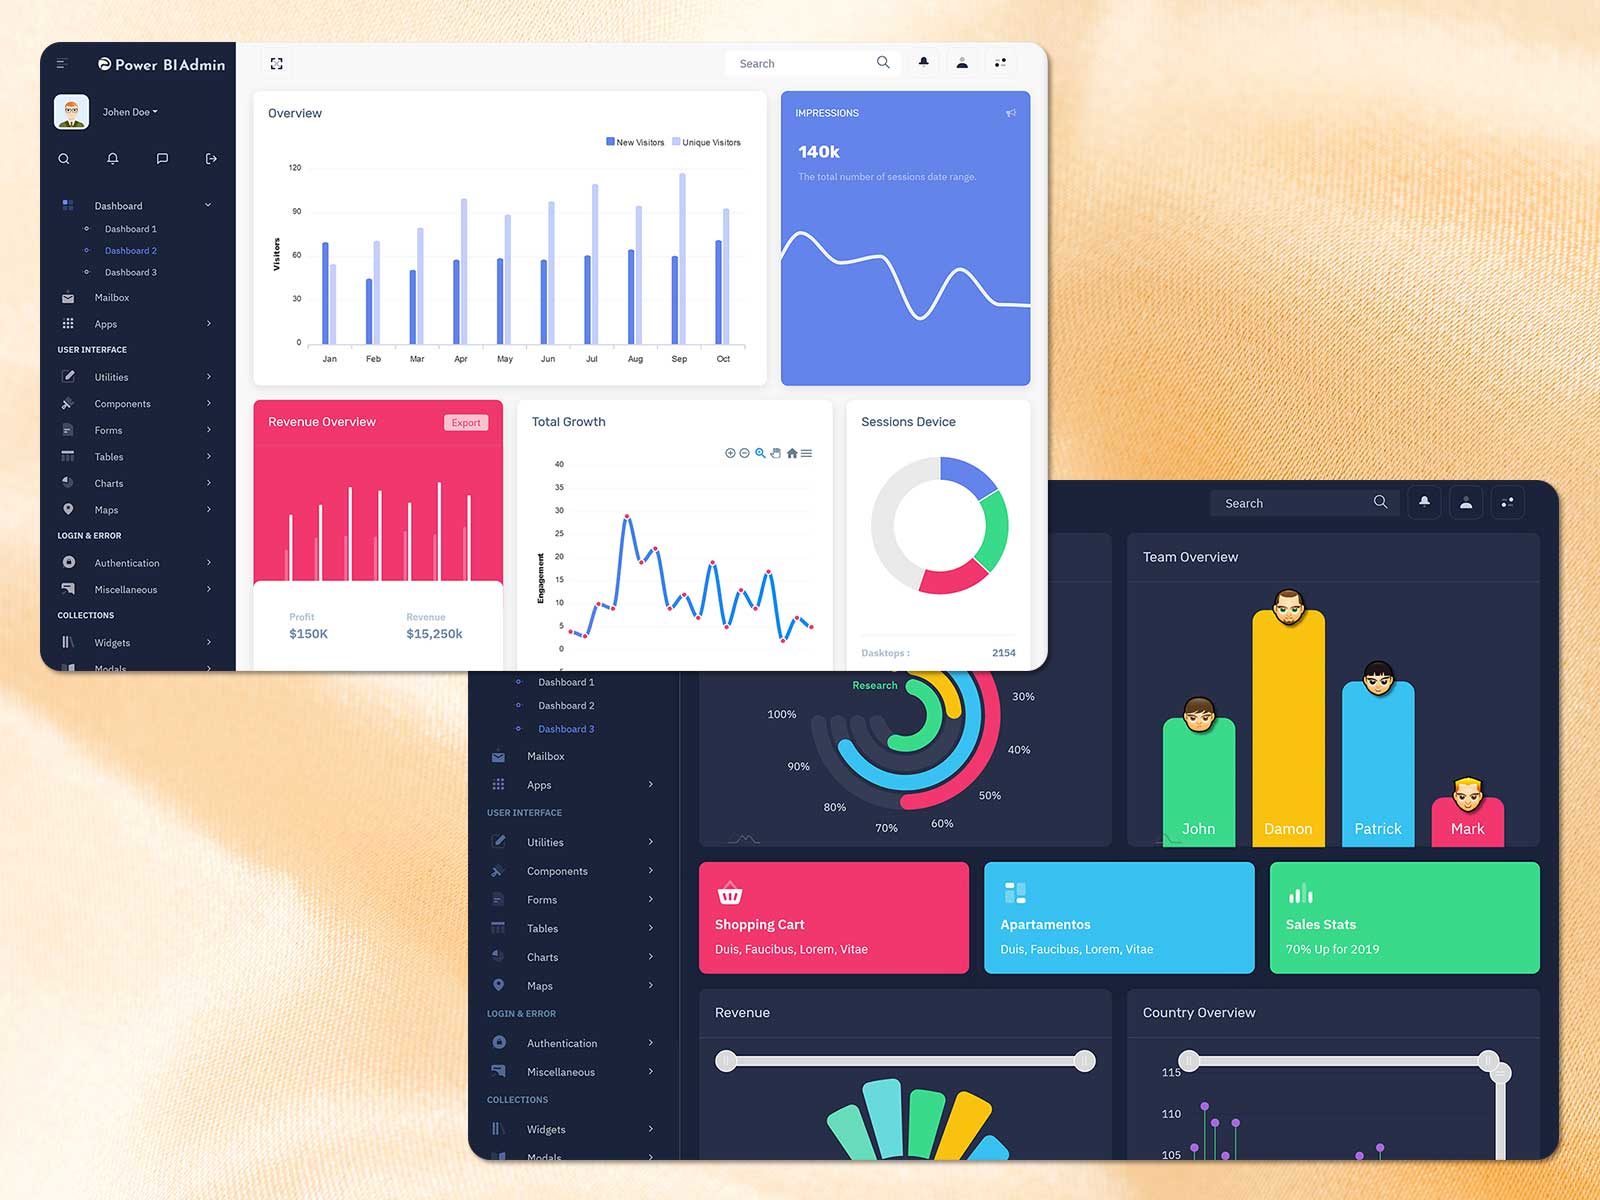
Advanced data engineering and analytics platform leveraging Python, NumPy, and Pandas for predictive inventory management, demand forecasting, and supply chain optimization. Power BI dashboards provide real-time visibility into stock levels, reorder points, and sales velocity across 200+ retail locations.
Data EngineeringRetail businesses face the constant challenge of balancing inventory->too much stock ties up capital and increases storage costs, while too little leads to stockouts and lost sales. This project addresses the critical need for intelligent inventory management in a multi-location retail chain. The client operated 200+ stores across Kenya with over 5,000 SKUs, generating 50,000+ daily transactions. Manual inventory tracking was inefficient, leading to frequent stockouts (costing KES 15M annually) and excess inventory (KES 8M tied up in slow-moving stock). The goal was to build a data-driven system that predicts demand, optimizes reorder quantities, and provides actionable insights.
.png)
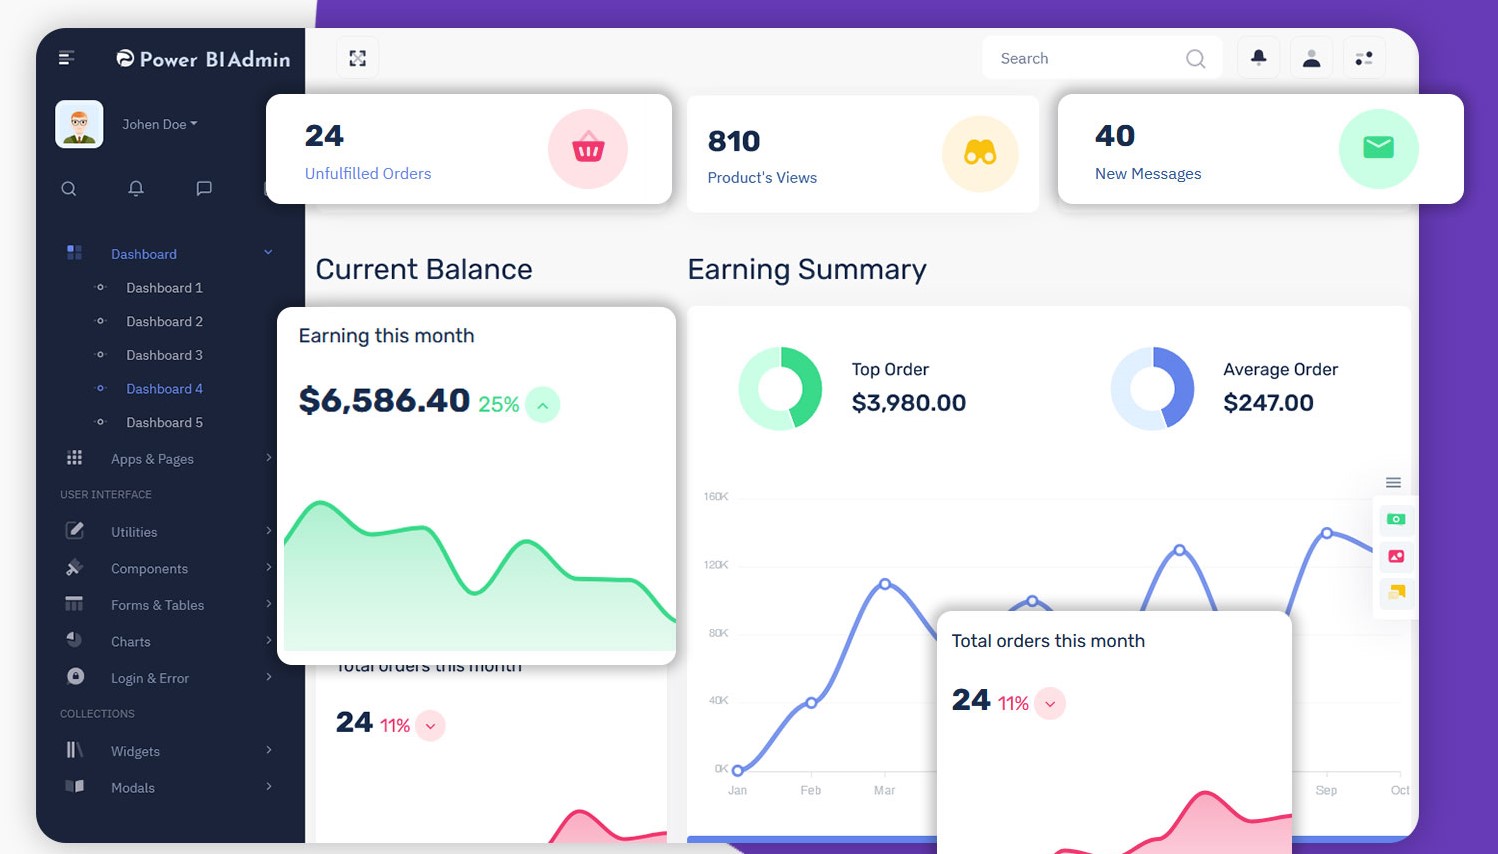
The retail chain's inventory management was reactive rather than proactive. Stock levels were manually monitored using spreadsheets, leading to human error and delays. There was no visibility into which products were fast-moving versus slow-moving across different locations. Seasonal demand patterns weren't captured, resulting in stockouts during peak seasons and excess inventory during slow periods. Suppliers weren't integrated into the system, causing delays in reordering. The business needed an automated solution that could forecast demand based on historical sales data, weather patterns, promotional activities, and local events.
Develop a comprehensive inventory analytics platform that processes 50,000+ daily transactions across 200+ locations, tracks 5,000+ product SKUs in real-time, predicts demand using time-series analysis and machine learning algorithms, calculates optimal reorder points and quantities using economic order quantity (EOQ) models, identifies slow-moving and fast-moving inventory with ABC analysis, and provides location-specific insights through interactive Power BI dashboards. The system should reduce stockouts by 70%, decrease excess inventory by 50%, and improve inventory turnover ratio by 40%.
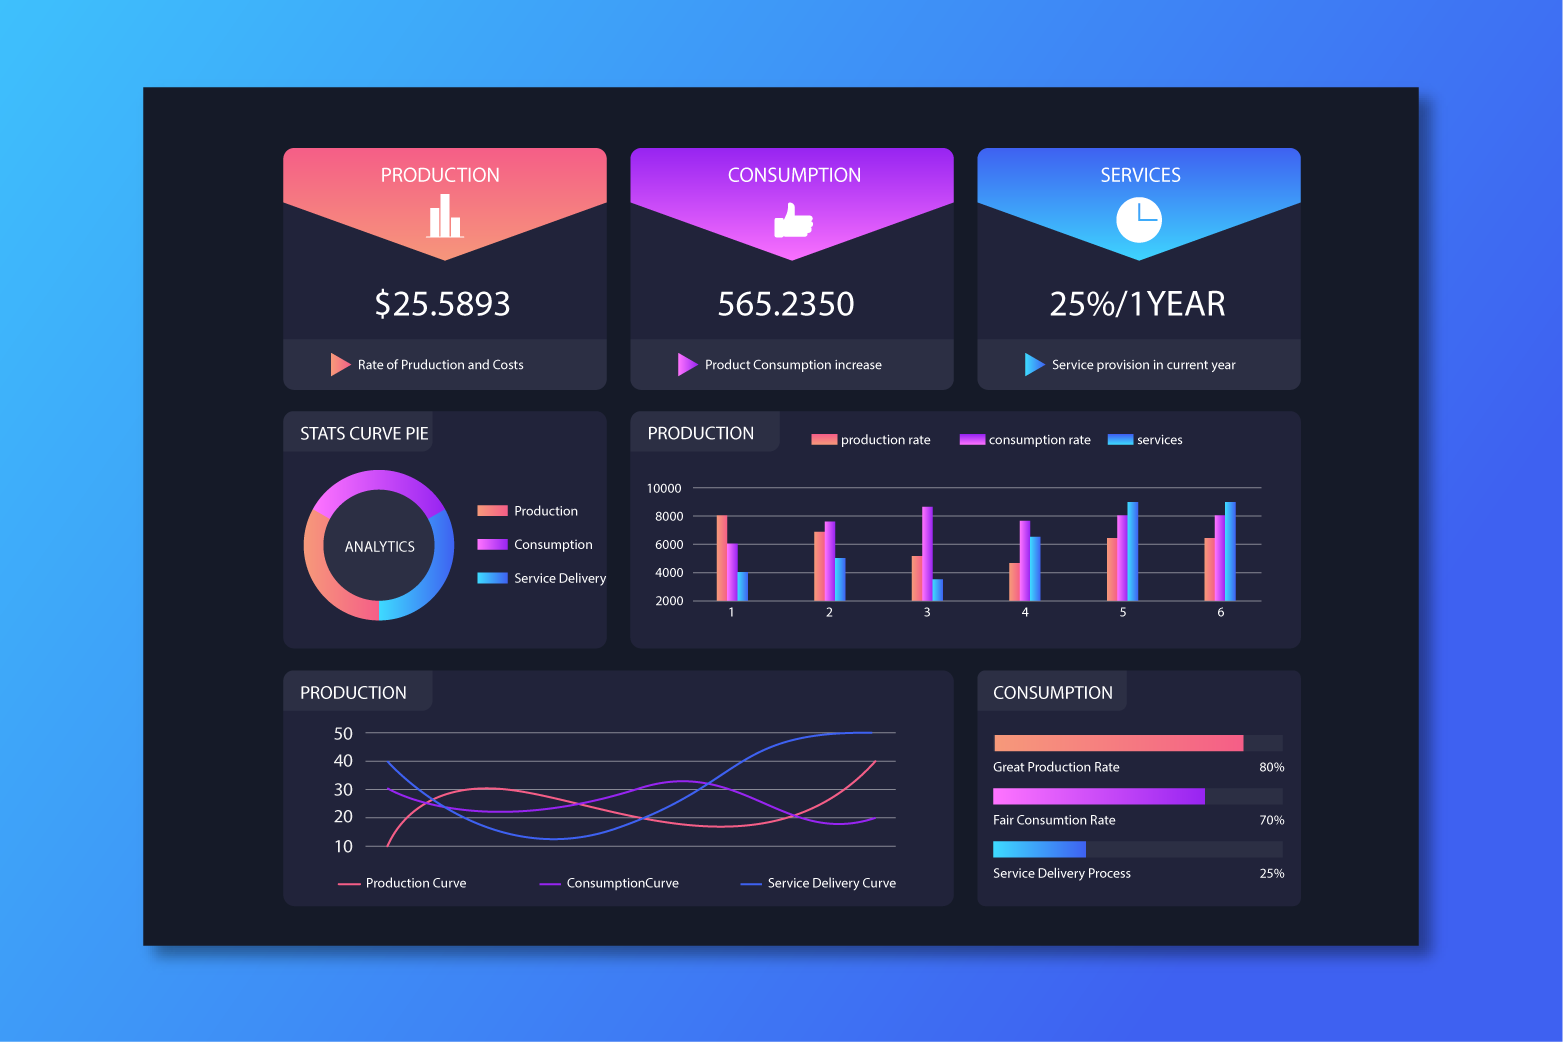
The intelligent inventory system revolutionized retail operations. Stockouts decreased by 73% (from 15% to 4%), directly increasing sales by KES 22M annually by ensuring popular products were always available. Excess inventory reduced by 58%, freeing up KES 12M in working capital that was previously tied up in slow-moving stock. Inventory turnover ratio improved from 4.2 to 6.8, indicating more efficient inventory management. The ABC analysis revealed that just 280 products (5.6% of SKUs) generated 80% of revenue, enabling focused inventory management on high-impact items. Demand forecasting achieved 87% accuracy, allowing proactive purchasing instead of reactive reordering. Supplier performance tracking identified 3 underperforming suppliers, leading to contract renegotiations and 25% reduction in lead times. Store managers now spend 60% less time on inventory management, reallocating effort to customer service.
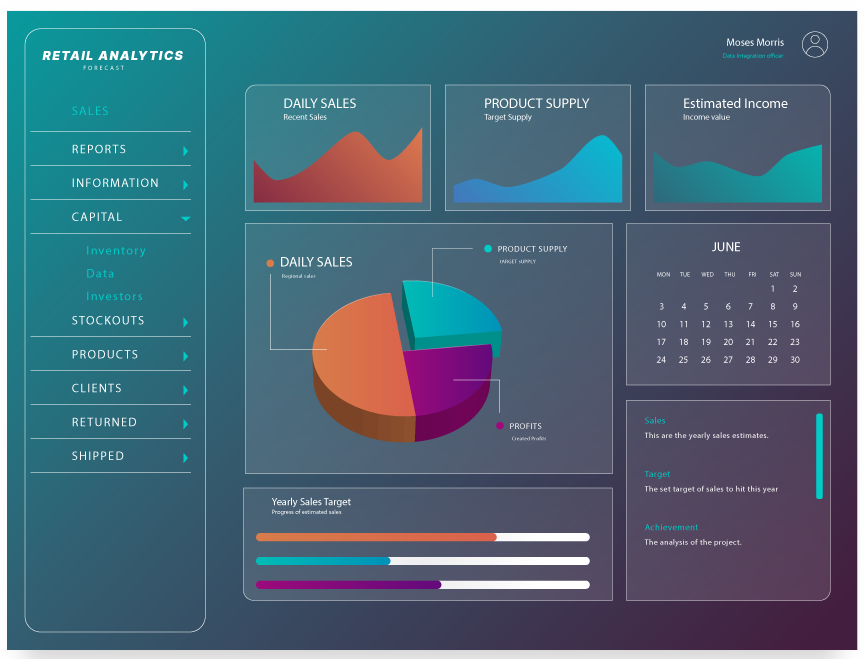
• Transactions processed: 50,000+ daily across 200+ locations (18M+ annually) • Products tracked: 5,000+ SKUs with real-time stock visibility • Stockout reduction: 73% (15% → 4% stockout rate) • Excess inventory reduction: 58% (KES 8M → KES 3.4M tied up) • Inventory turnover improvement: 62% (4.2 → 6.8 turns per year) • Working capital freed: KES 12M from inventory optimization • Additional revenue: KES 22M annually from reduced stockouts • Demand forecast accuracy: 87% for top-selling products • ABC Analysis: A-items (5.6% SKUs) = 80% revenue, B-items (15% SKUs) = 15% revenue, C-items (79.4% SKUs) = 5% revenue • Reorder efficiency: 45% reduction in emergency orders • Supplier lead time: 25% improvement (8 days → 6 days average) • Dashboard usage: 180+ daily active users (store managers, regional heads, executives) • ROI: 420% within first year of implementation
Let's us talk about your idea and how I can help bring it to life.
An Engineer, Data Whisperer, StoryTeller in Words and Code.
Helping people solve real world problems.
Hi 👋
Need help? Chat with us on WhatsApp!